

Key Takeaways
Fuel economy rating
A fuel economy rating tells you how far a vehicle can travel on a fixed amount of fuel, measured in miles per gallon (MPG) in the United States. The EPA tests vehicles under controlled lab conditions and prints the results on the window sticker of every new car sold. Higher MPG means the vehicle uses less fuel to travel the same distance, which lowers what you spend at the pump.
For plug-in hybrids and electric vehicles, the EPA uses MPGe (miles per gallon equivalent), which converts electrical energy consumption into a gasoline equivalent so consumers can compare across powertrains.
What the EPA window sticker actually shows
Every new vehicle sold in the US carries a Monroney label, the official window sticker that includes EPA fuel economy data. The label shows three separate figures: city MPG, highway MPG, and combined MPG. Each reflects a different testing cycle.
City MPG comes from a test that simulates urban driving with frequent stops and restarts. Highway MPG reflects sustained speeds with minimal stopping. Combined MPG blends the two at a 55% city and 45% highway weighting. For most families, combined MPG is the figure closest to everyday experience, though households that commute long distances on freeways will find highway MPG more predictive.
The sticker also shows an estimated annual fuel cost based on a fixed assumption of 15,000 miles per year and a national average gas price. Because gas prices change constantly and your mileage may differ, treat that cost estimate as a rough comparison tool rather than a precise budget figure. For a fuller picture of what a vehicle actually costs to own, see our guide on total cost of ownership, which covers fuel alongside insurance, maintenance, and depreciation.
Why real-world MPG differs from the label
EPA ratings are a standardized benchmark, not a guarantee. Real driving introduces variables the lab does not fully capture.
- Speed: Aerodynamic drag rises sharply above 60 mph, so highway driving at 75 or 80 mph burns meaningfully more fuel than the test cycle assumes.
- Load: A vehicle carrying five passengers and a full cargo area weighs more and uses more fuel than an empty car.
- Temperature: Cold weather thickens engine oil and battery chemistry in hybrids, reducing efficiency. Air conditioning adds load year-round.
- Driving style: Rapid acceleration and hard braking both waste fuel compared to smooth, gradual inputs.
- Tire pressure: Under-inflated tires increase rolling resistance and cut MPG.
The EPA publishes a range on the sticker alongside the main figures to account for this variation. A vehicle listed at 30 MPG combined might show a range of 26 to 34 MPG. If your real-world result falls within that range, the vehicle is performing as expected.
Check your actual consumption over time
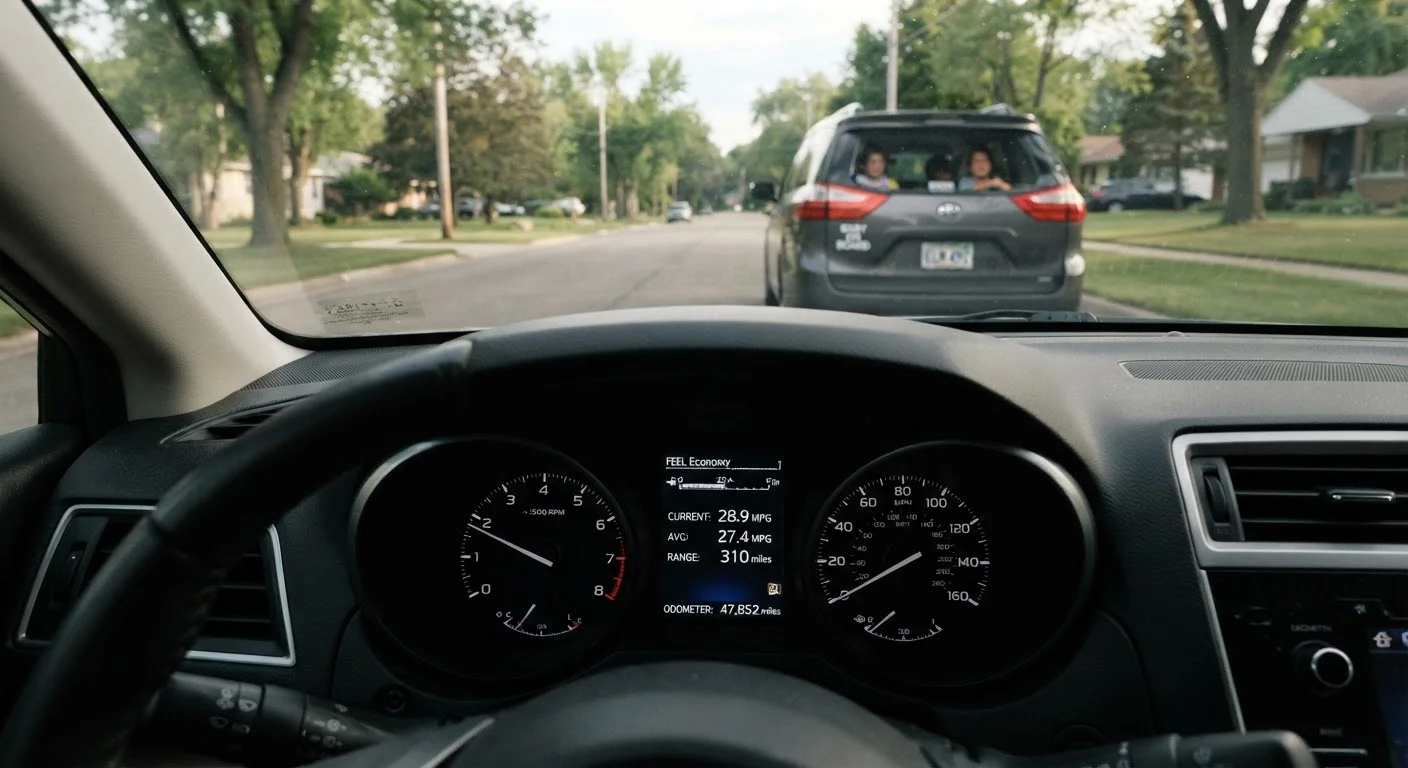
Most modern vehicles display a real-time or average fuel economy readout on the dashboard. Resetting this display at each fill-up and comparing it to the gallons pumped gives you an accurate personal MPG figure. Tracking this across seasons can reveal how temperature and driving patterns affect your specific vehicle.
MPGe and electric vehicles: reading a different scale
When a vehicle runs partly or entirely on electricity, MPG no longer captures its energy use. The EPA uses MPGe instead. One gallon of gasoline contains roughly 33.7 kilowatt-hours (kWh) of energy, so MPGe expresses how many miles a vehicle travels on that equivalent amount of electrical energy.
A fully electric vehicle might show 100 MPGe or higher, but that number does not translate directly to fuel savings without knowing local electricity rates. In regions where electricity is cheap, operating cost per mile can be much lower than a gas vehicle. Where electricity rates are high, the gap narrows. The EPA's fueleconomy.gov tool lets you enter your local electricity and gas prices to calculate a side-by-side cost comparison.
Plug-in hybrids show two sets of figures: one for electric-only operation and one for gas engine operation. The electric range listed is the distance the vehicle can travel on battery before the gas engine takes over. Families who can charge at home nightly and have short daily commutes may rarely use the gas engine, while those without home charging will rely on the gas rating most of the time.
3.5 MPG
Average real-world MPG gap below EPA city estimate
EPA data shows consumers typically achieve about 3 to 4 MPG less in city driving than the rated figure due to real-world conditions.
33.7 kWh
Energy in one gallon of gas, used to calculate MPGe
The EPA uses this equivalence to standardize energy comparisons between electric and gasoline powertrains on the window sticker.
$600+
Potential annual fuel savings from 10 MPG improvement
Based on 15,000 annual miles at a $3.50-per-gallon gas price, a 10 MPG improvement reduces fuel spend by roughly $600 per year.
Translating MPG into annual dollars
Abstract MPG numbers become meaningful when converted to cost. The math is straightforward: divide your annual mileage by the vehicle's MPG to get gallons used per year, then multiply by the local gas price.
A family driving 15,000 miles per year in a vehicle rated at 25 MPG uses 600 gallons annually. At $3.50 per gallon, that is $2,100 per year in fuel. The same driving in a 35 MPG vehicle uses about 429 gallons, or roughly $1,500 per year. The $600 annual difference compounds over five years of ownership into $3,000 in savings, without accounting for any change in gas prices.
That calculation changes if you drive significantly more or less than average. Families with long commutes or frequent road trips benefit more from high-MPG vehicles because the savings multiply with every additional mile. Those who drive less than 10,000 miles per year may find that a small fuel economy difference matters less than purchase price or reliability.
For context on how fuel costs fit within broader ownership decisions, the sedan, minivan, SUV, and crossover comparison walks through how body style affects both fuel use and running costs across different family needs.
Using fuel economy data alongside other ratings
Fuel economy is one input in a larger decision. A vehicle with excellent MPG but a poor reliability record can cost more to own than a less efficient but more dependable option. Repair frequency, scheduled maintenance intervals, and parts costs all affect the true annual cost of keeping a vehicle on the road. Reading reliability scores correctly explains what survey data and complaint records actually measure and how to weigh them alongside fuel economy.
Safety ratings from NHTSA and IIHS are separate from fuel economy data and should be checked independently. A higher MPG figure says nothing about crash protection. Families with children will want to cross-reference fuel economy with safety evaluations; crash test ratings for child passenger safety covers what those scores measure in practice.
If you are comparing vehicles across powertrain types, checking MPGe alongside reliability data and financing terms gives a more complete picture before committing to a purchase.